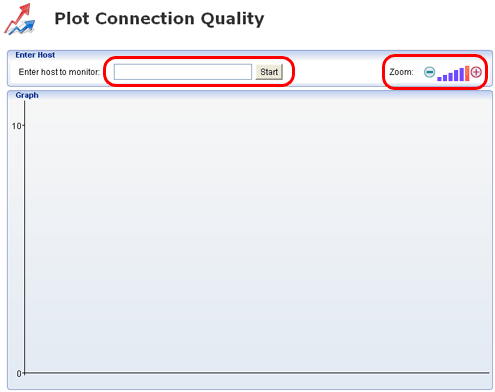
Simply enter the host you want to monitor and click the start button. VisualRoute will then start plotting response times between the VisualRoute server and your chosen host. As you can see in the image above there are zoom toggles in the top right hand corner. This is useful when lots of data has been plotted and you need to get a wider view of how the host has been performing.
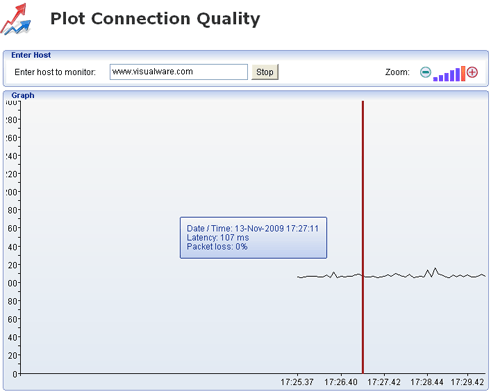
You can also click anywhere on the applet for more information on a specific part of the plot, as shown by the red bar and tool tip shown above, shown below:
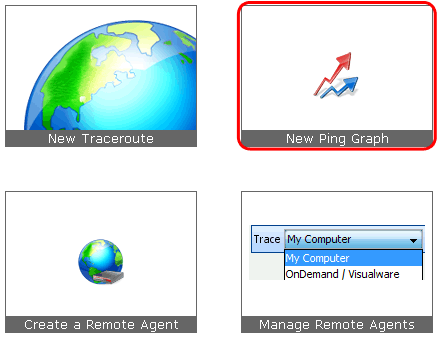
|